Node.js ships with a built-in debugger that you can use to debug your Node.js applications via the command-line. But you are not limited to debugging in the terminal, Chrome also ships with a debugger that enables a Graphical User Interface(GUI) debugging workflow. With the Chrome debugger, you can watch your variables and see the variable values change as you step through the code. You can also set breakpoints in your code to tell the debugger where to pause so that you can investigate the problem.
In this tutorial, you will use the Chrome debugger to debug a Node.js application. First, you will step through the code using the debugger toolbar buttons. You will then set breakpoints in your code to tell the debugger where to pause. After that, you will watch variables and use the debugger statement to debug your code.
What is Debugging?
Debugging is the process of finding bugs in your code and fixing them. The bugs tend to be errors in your code that causes an application to produce unexpected results or behave in a different way than intend. Using a debugger, you can pause the execution of your code in places you suspect the bug. From there, you can step through the code line by line to investigate further and find the source of the bug and apply a fix. This is a much better workflow as opposed to using console.log() statements which can clutter the output and make it harder to debug.
Getting Started with the Chrome Debugger
In this section, we will create the directory for the project, and the Node.js program that we will debug with the Chrome debugger.
Create a project directory and move into it with the following command:
- mkdir debug-nodejs && cd debug-nodejs
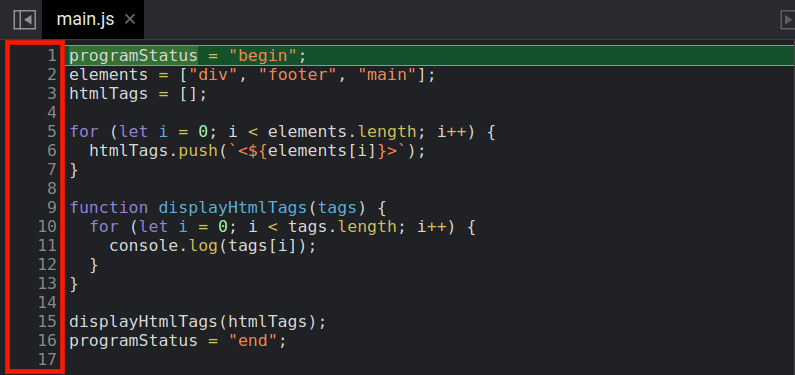
Next, create a main.js file in your editor and add the following:
programStatus = "begin";
elements = ["div", "footer", "main"];
htmlTags = [];

for (let i = 0; i < elements.length; i++) {
  htmlTags.push(`<${elements[i]}>`);
}

function displayHtmlTags(tags) {
  debugger;
  for (let i = 0; i < tags.length; i++) {
    console.log(tags[i]);
  }
}

displayHtmlTags(htmlTags);
programStatus = "end";
In the preceding code, you create a Node.js program that takes strings in an array, turns them into HTML tags, and logs them in the console. The string values are in the elements array. To turn them into HTML tags, you iterate over each element in the elements array, turn it into an HTML tag, then push each element into the htmlTags variable. You then call the displayHTMLTags() function with the htmlTags variable, which iterates and log each array element in the console.
To start the debugger, enter the following command:
- node --inspect-brk main.js
The --inspect-brk option tells the debugger client to pause on the first line.
When you run the command, it will show the following:
OutputDebugger listening on ws://127.0.0.1:9229/76f37272-ee20-47c2-8ab7-21c06f53cabe
For help, see: https://nodejs.org/en/docs/inspector
In the output, Node.js confirms it is listening for debug messages on port 9229.
Now, launch Chrome or any Chromium-based browser, then visit chrome://inspect/. The page will look as follows:
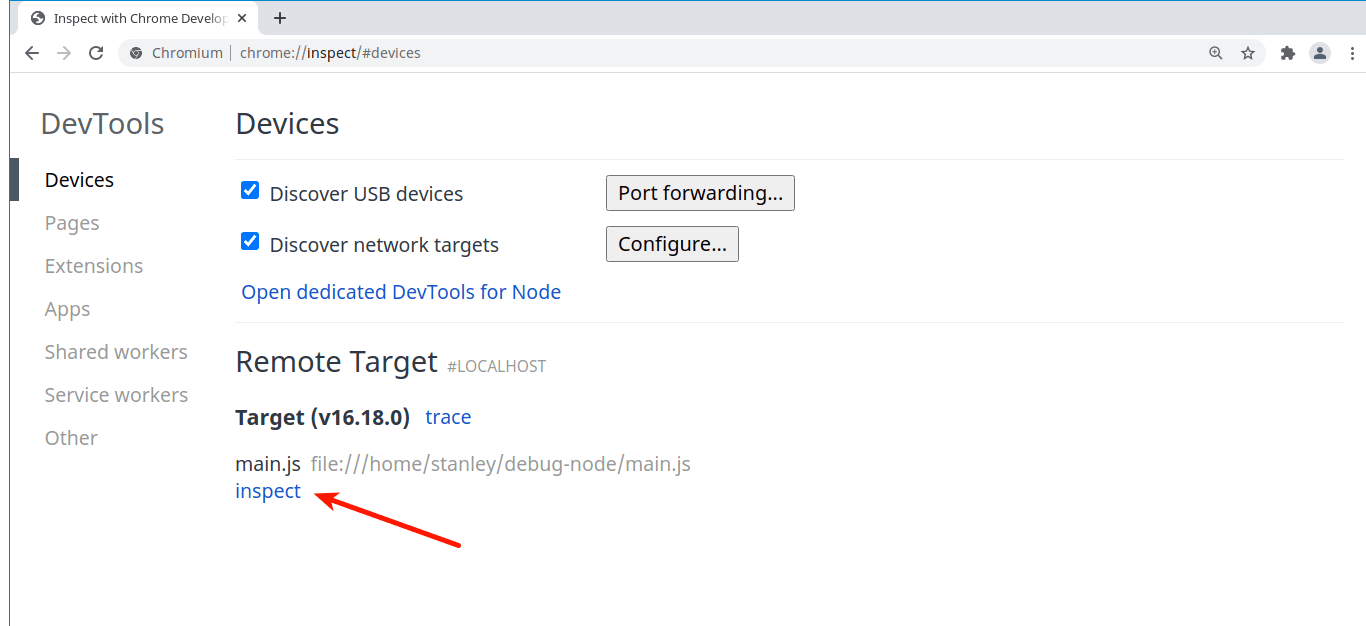
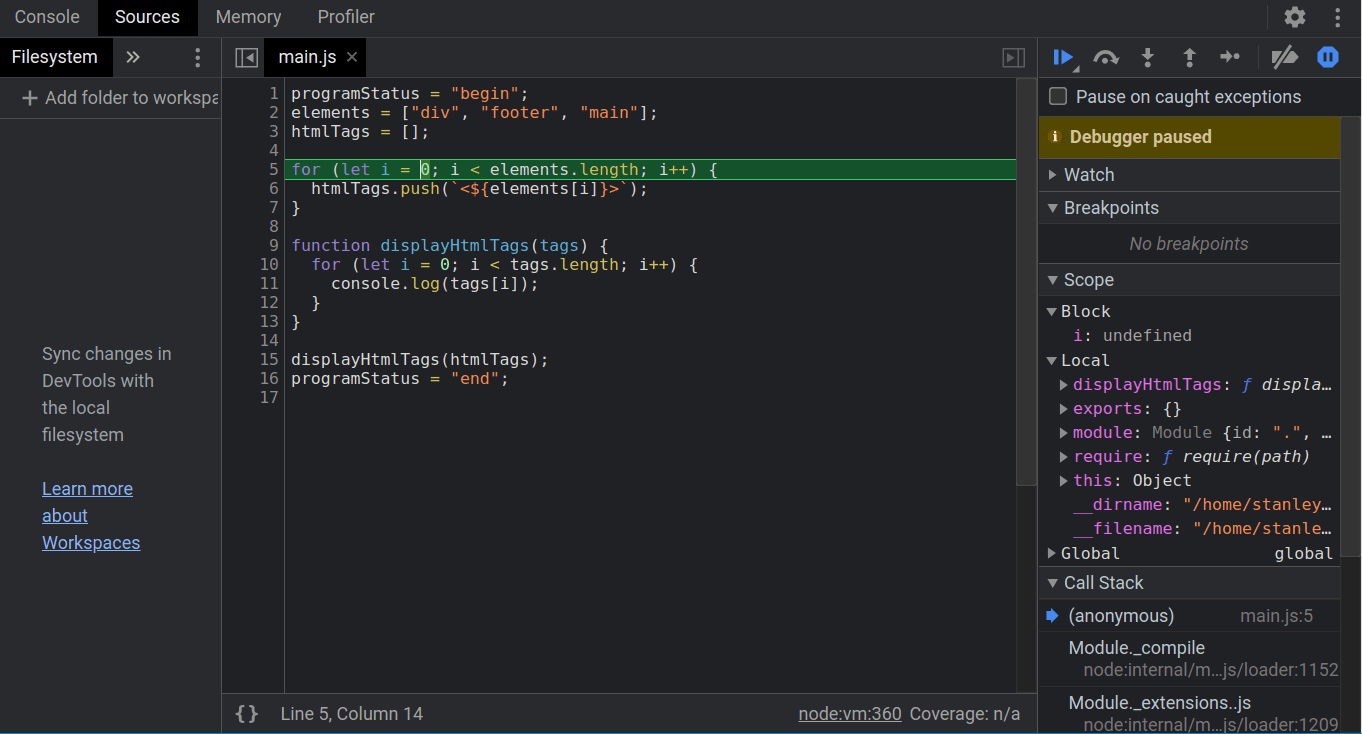
Make sure you are under the Devices header, then click inspect. This will open a DevTools window that looks like this:
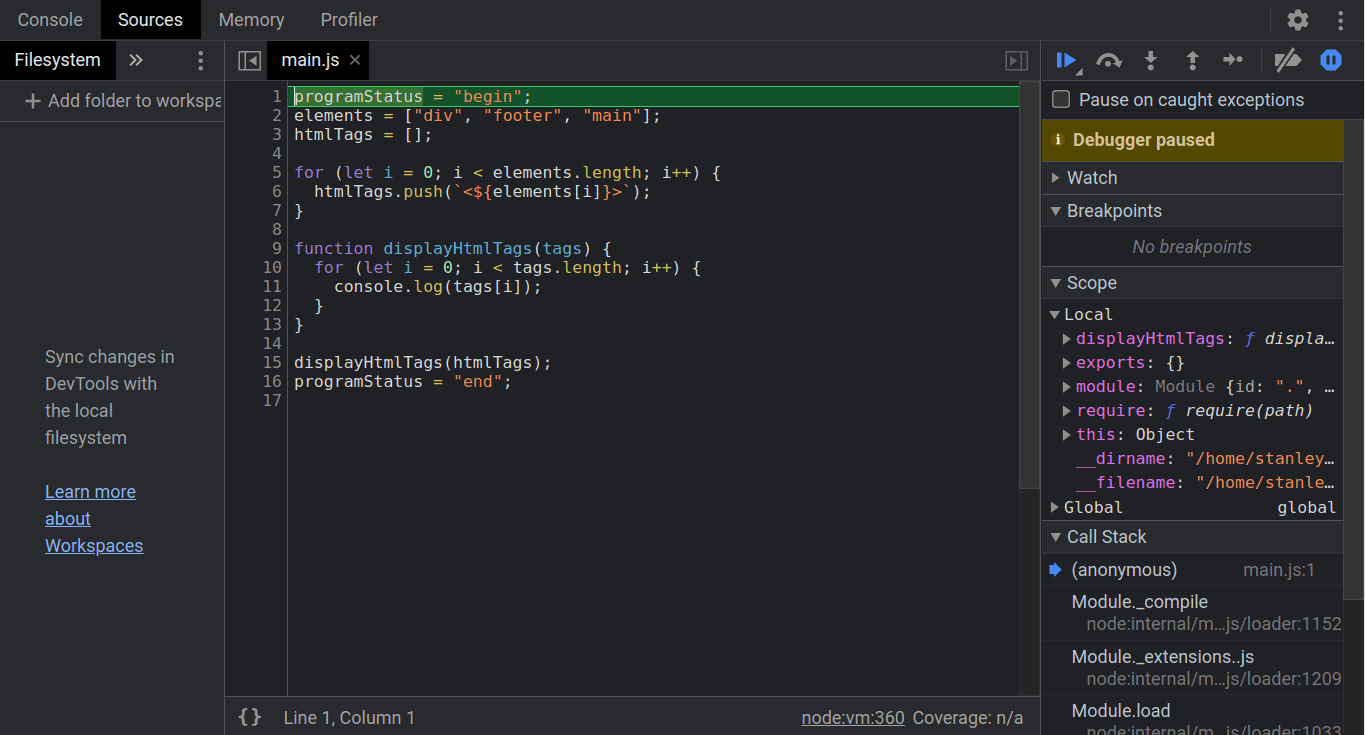
You are now ready to start debugging the Node.js script. By default, when the debugger opens, it pauses on line 1 as indicated by the highlighted color. If you return to the terminal, you will also see the message Debugger attached, which confirms that the Chrome debugger is attached to the Node.js process.
Now that the Chrome debugger is running, you will step through the code in the next section.
Navigating Through Code Using the Debugger
In this section, you will step through the code using the buttons in the Chrome Debugger.
Most of the navigation buttons are in a Debug toolbar that looks like this:
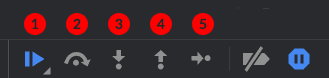
Let's go over some of the buttons:
- Resume script execution: Continue executing your code and pauses on each breakpoint.
- Step over next function call: Steps through the code and executes every function it counters. It does not step into a function and pause.
- Step into next function call: Steps through the code and when it counters a function call, it steps into the function and pauses on the first line.
- Step out of current function: If you are paused in a function, it executes all the subsequent code and pauses one line after the function call.
- Step: Useful for asynchronous code. It pauses inside a callback that is passed into an asynchronous method like
setTimeout(). We won't be using it in this tutorial.
To understand how the buttons work, let's start with the second button Step over next function call.
To go to the next line in the debugger, click Step over next function call:![]()
The debugger will now pause on line 2:

Let's execute line 2 and pause on line 3. This time, click Step into next function call:
![]()
Clicking the button causes the debugger to execute line 2 and pause on line 3 as shown:
To pause on line 5, click Step into next function call one more time:
When a debugger encounters a blank line it skips over it. That's why the debugger is now on line 5 instead of 4.
At this point, you might get the impression that the Step over next function call and Step into next function call buttons works the same way. However, there is an important difference between the two. Step over next function call executes a function without stepping into it while Step into next function call steps into a function and pauses on the first line.
To see the difference, close the debugger window.
Create a displayTags.js file and add the following content:
htmlTags = ["<div>", "<footer>", "<main>"];

function displayHtmlTags(tags) {
  for (let i = 0; i < tags.length; i++) {
    console.log(tags[i]);
  }
}

displayHtmlTags(htmlTags);
console.log("finished");
In the preceding code, you define the htmlTags variable with an array of HTML elements. Next, you define the displayHtmlTags() function that iterates over a given array and logs each element in the console. To log each element in htmlTags, we call displayHtmlTags() function with the htmlTags variable.
Now start the debugger with the displayTags.js file:
- node --inspect-brk displayTags.js
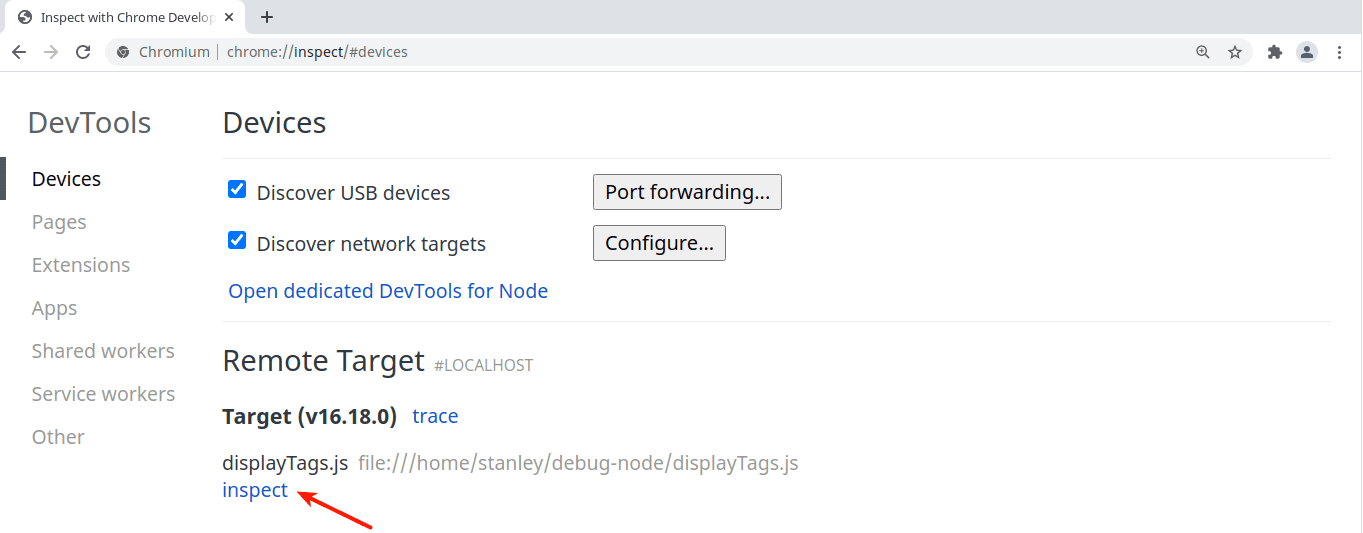
Open Chrome and visit chrome://inspect/. On the page, click inspect:
When the debugger window opens, click Step over next function call:
![]()
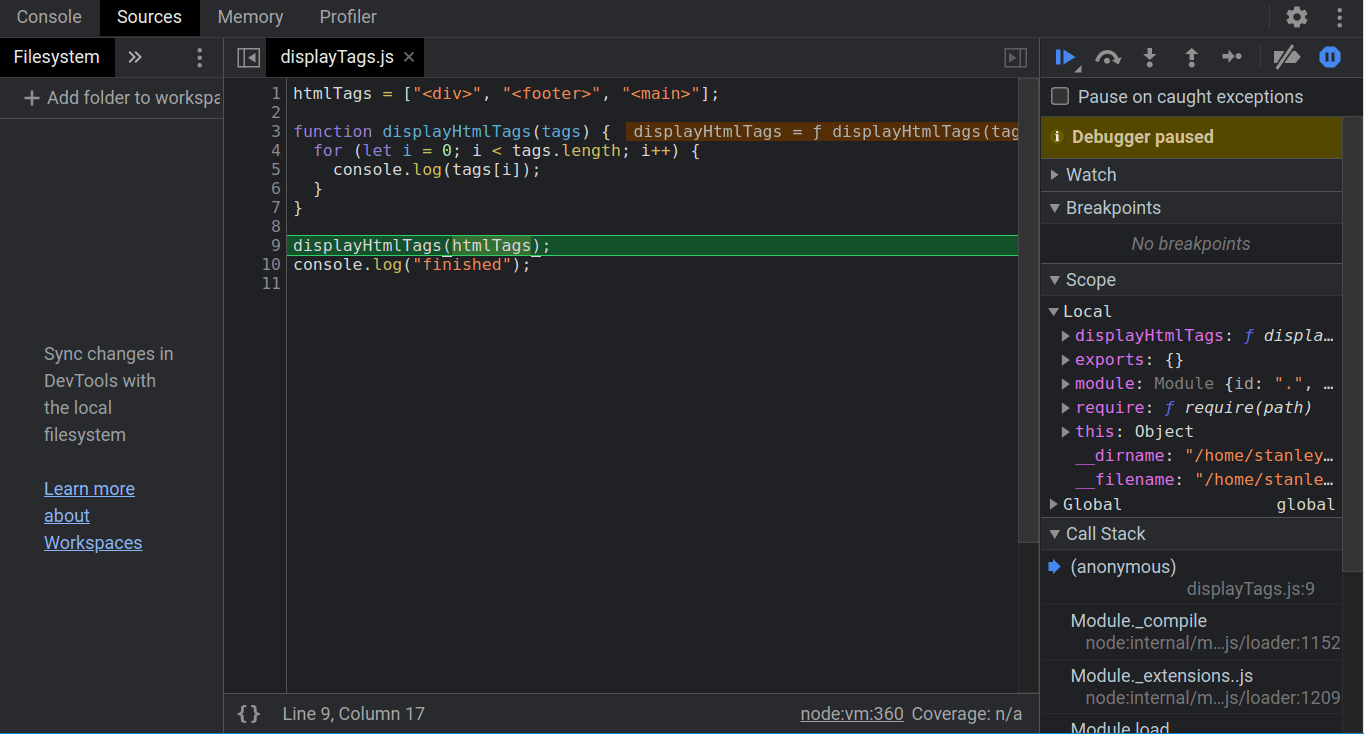
The debugger will pause on line 9:
Click Step over next function call two times and closely observe what happens.

You will notice that the debugger pauses on line 10 and does not step into the displayHtmlTags() function and pause.
If you return to the terminal, you will notice that the output that the function generated has been logged:
Output...

Debugger attached.

<div>
<footer>
<main>
So using the Step over next function call button allows you to skip debugging functions that you know are irrelevant to your bug.
For cases when the source of the bug is in the function, use the Step into next function call button to step into the function. Let's see how it works in comparison to the Step over next function call.
Close the debugger window, then run the following command to start a new debugging session with the displayTags.js file again:
- node --inspect-brk displayTags.js
As we have been doing, visit or reload chrome://inspect. Under devices, click inspect to open the debugger window.
In the debugger, click Step into next function call three times and observe closely from line 9 onwards:
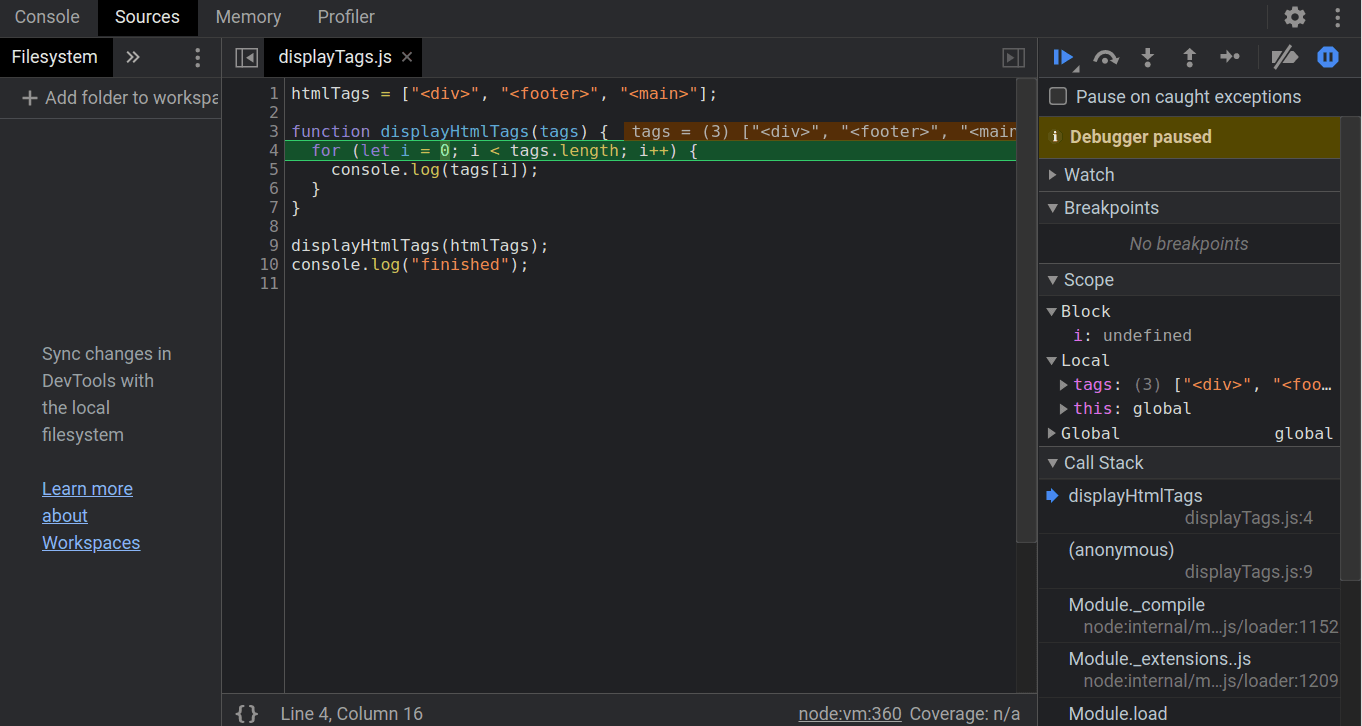
You will now notice that the debugger has paused on the first line inside the displayHtmlTags() function.
In the function, you can continue executing the code with the Step into next function call or Step over next function call buttons. Just beware that Step into next function call might cause the debugger to step into Node.js methods like the console.log() method. So it's recommended to use Step over next function most of the time. If you want to step into the function and debug it, use Step into next function call
To get out of the function without stepping through the rest of the code, click Step out of current function: ![]()
Upon clicking the button, the function will finish executing and the debugger will pause on line 10:
You can now close the debugger window.
Now that you can move through your code with the debugger, you will use breakpoints in the next section.
Setting Breakpoints
So far, we have been using buttons to move through the code with the debugger from line 1, which is a bit tedious. Imagine if your application had hundreds of lines of code, stepping through the code line by line would be time-consuming.
To remedy this, the Chrome debugger has breakpoints, which are temporally makers that can be placed on any line to specify where the debugger should pause.
Continuing with the main.js file, start another debugging session:
- node --inspect-brk main.js
Visit or reload chrome://inspect page. Under devices, click inspect to open the debugger window.
To set breakpoints in the debugger, you can click on any line you prefer on the line number column:
Let's set breakpoints on lines 10 and 16. Click on lines 10 and 16 in the line number column as shown below:
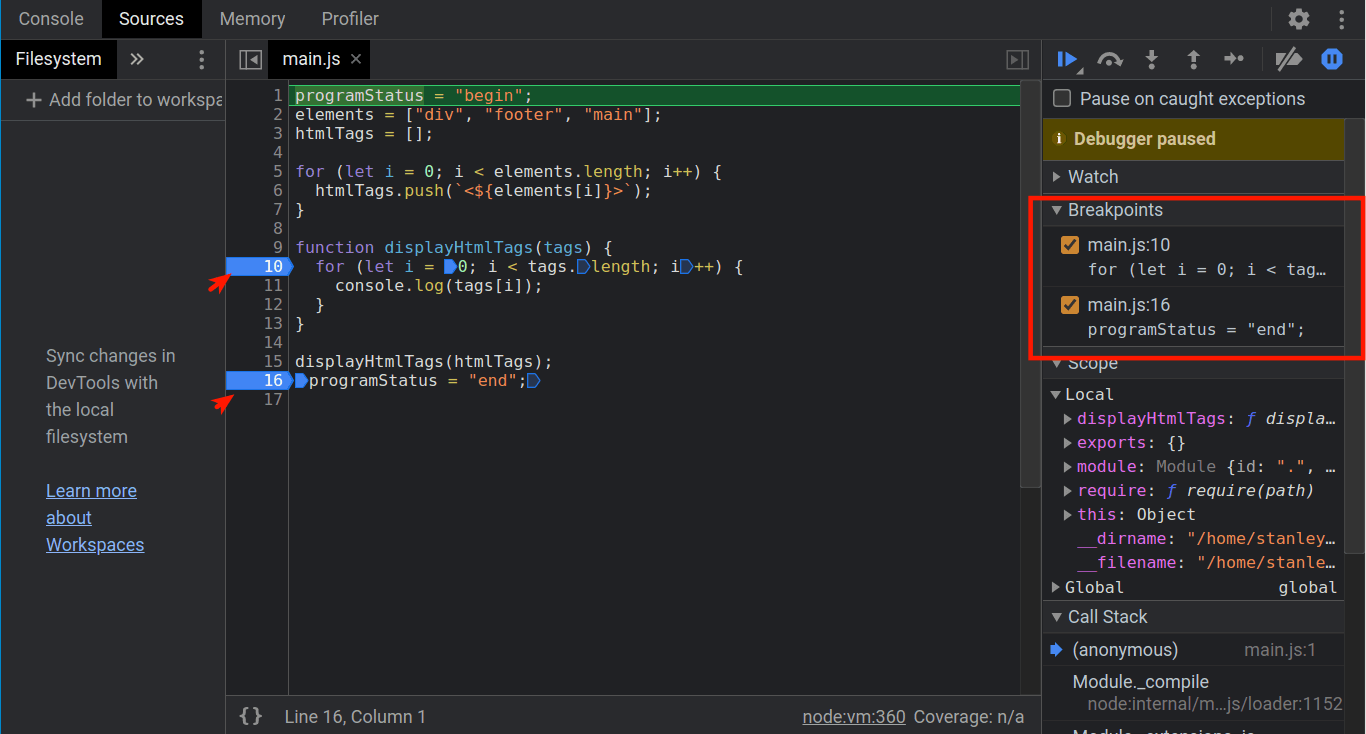
Upon clicking the lines, two blue icons appear on the line number column. You may also notice that the Breakpoints pane now has two breakpoints.
At this point, the debugger is still paused on line 1. To pause on the first or any breakpoint, you must use the Resume script execution button. The button triggers the debugger to continue executing and pause when it encounters a breakpoint.
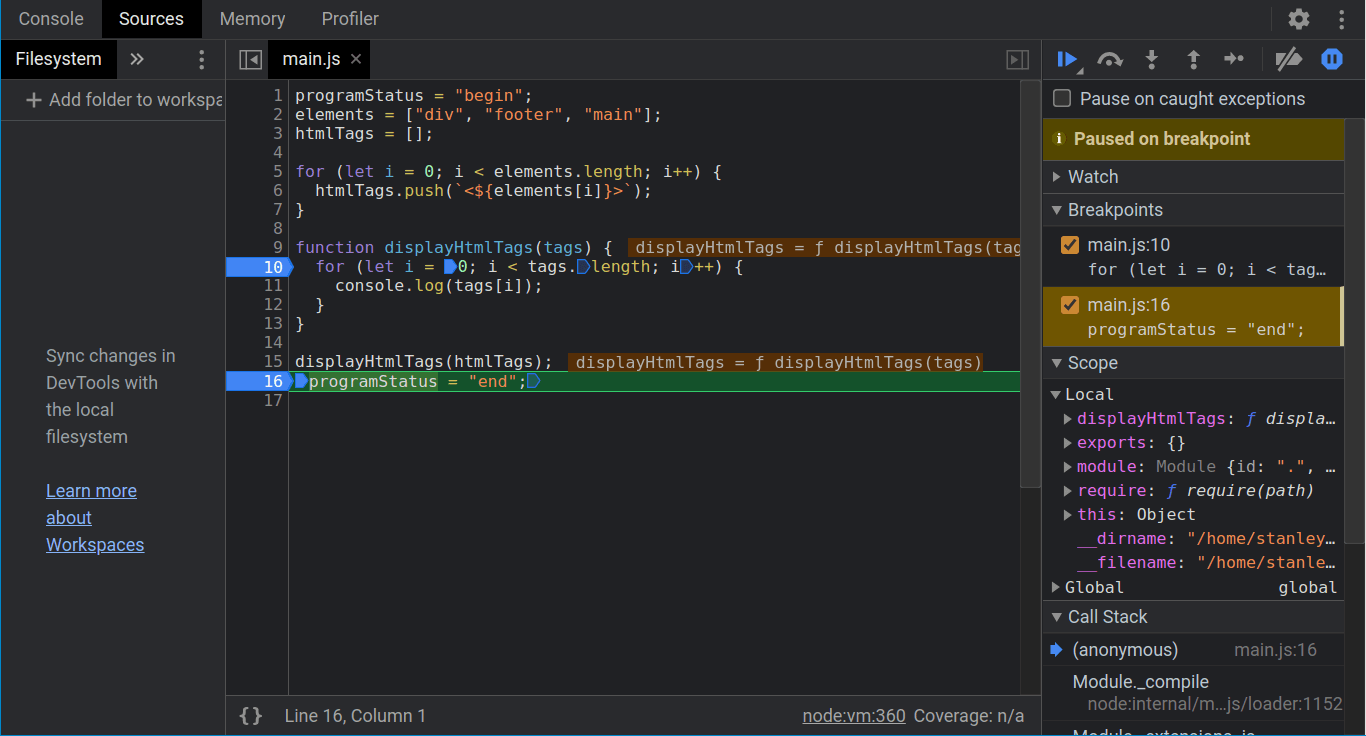
To pause on line 10, click Resume script execution: 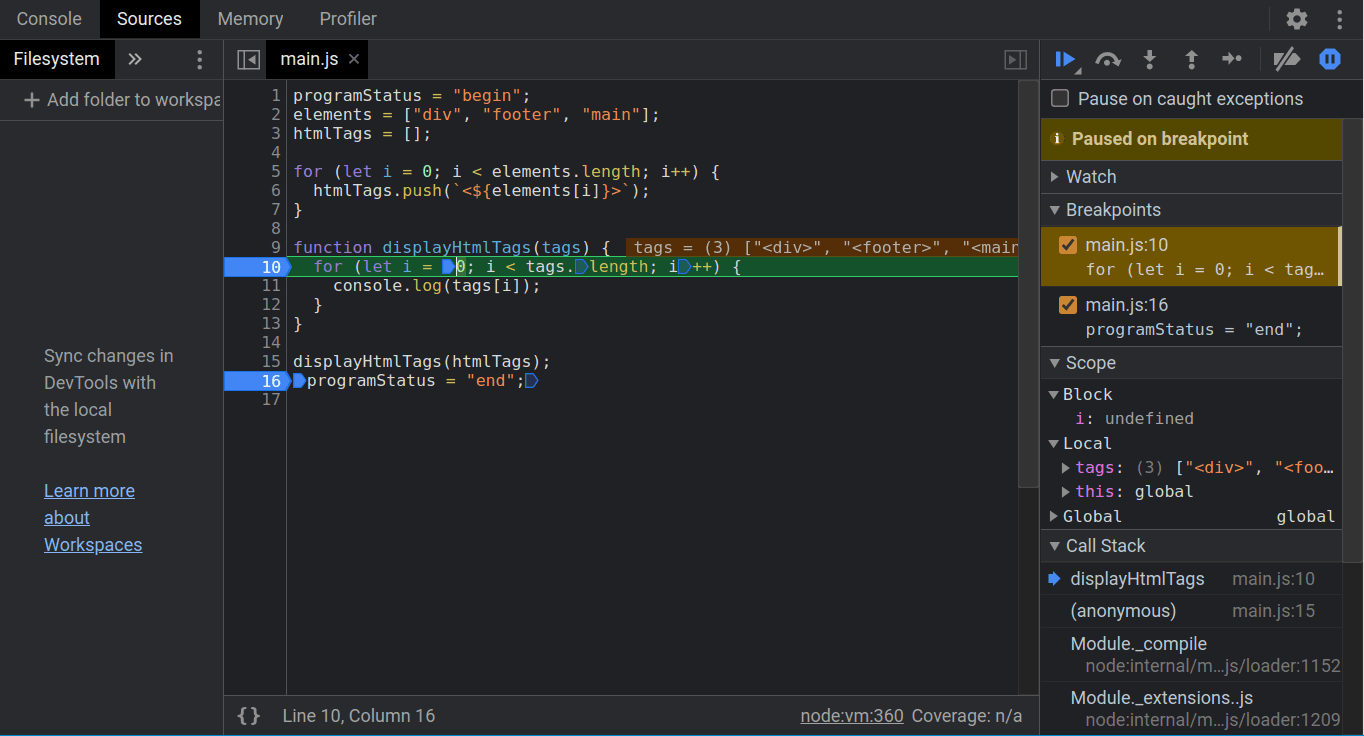
From there, you can use the other buttons we have learned to step through the code. If you need to quickly iterate the code to go to line 16, click Resume script execution:
With that, close the debugger window.
Now that you know how to set breakpoints, you will watch the variables next.
Watching Variables
So far, we have been stepping through code using buttons and breakpoints without examining the state of the application. In the Chrome debugger, you can set the variables you want to watch and the debugger will update the variable values as you step through the code.
We will continue with the main.js file in this section. So let's start the debug session again:
- node --inspect-brk main.js
Refresh or visit chrome://inspect page. Under devices, click inspect to open a debugger window.
You should see the debugger window with the breakpoints still enabled:
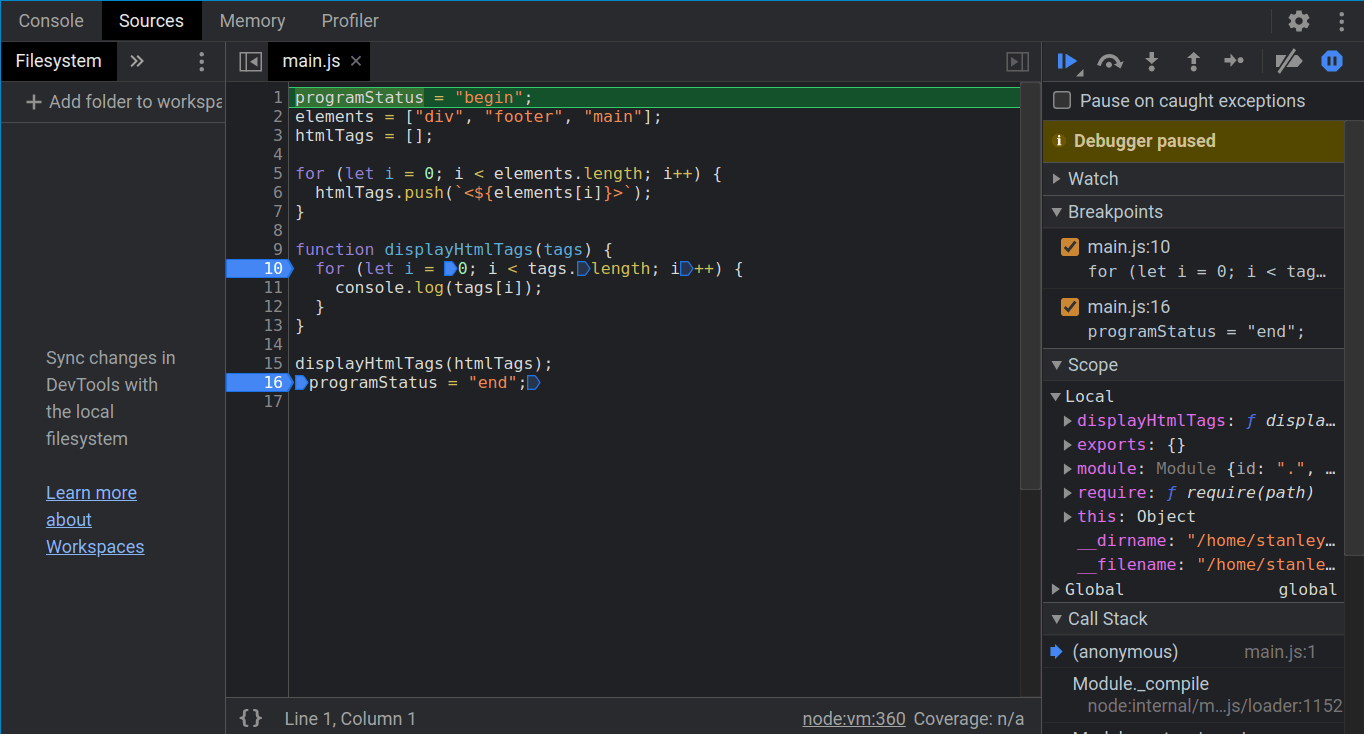
As you can see, the breakpoints don't get removed when you close the debugger. The benefit of this is that you can take breaks between debugging and not have to worry about setting breakpoints every time you close the debugger.
Now, to watch variables, you add the variable name in the watch pane using the Add watch expression button, which is the plus icon in the following screenshot:
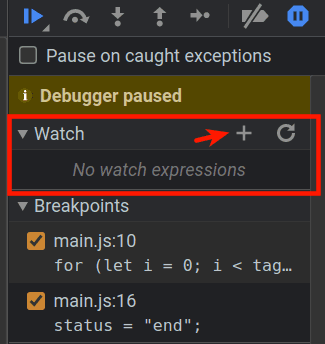
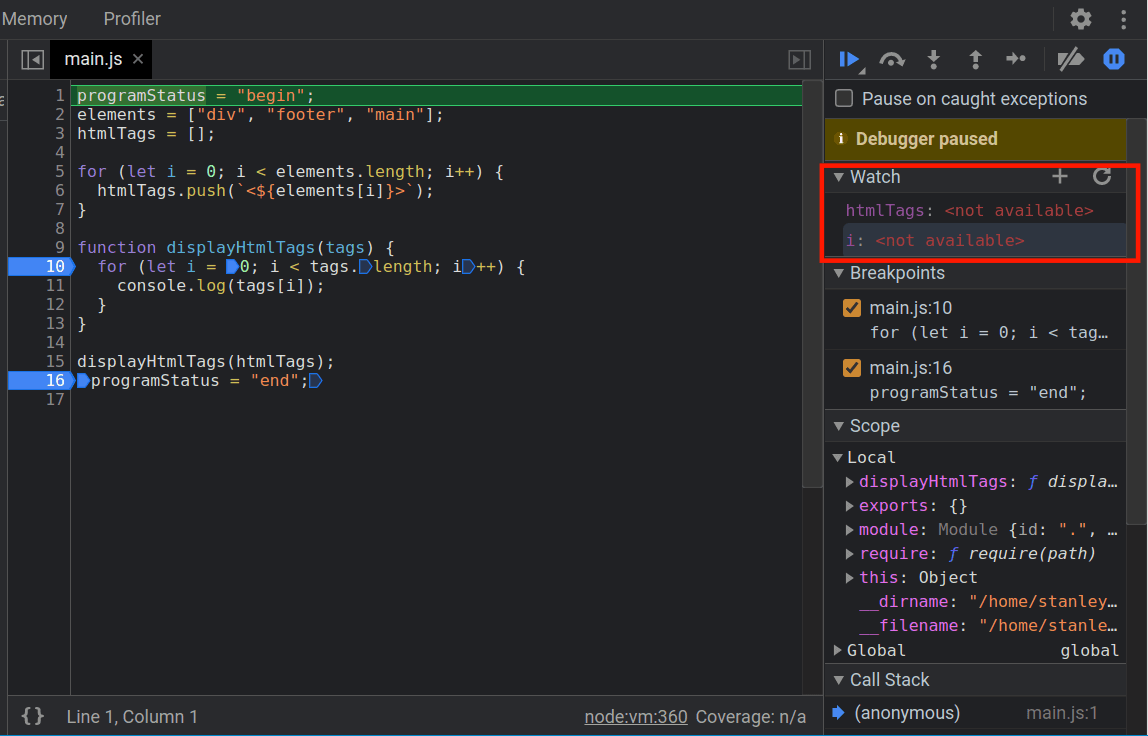
Let's watch the htmlTags and the i variables. Click the Add watch expression button and enter the variable name htmlTags, then press ENTER. If the variable name is auto-corrected to another variable name, click outside the text input area. Repeat the same steps for the i variable.
The watch pane will now look like this:
You are now watching the htmlTags and i variables. Let's continue execution until the next break point. Click the Resume script execution button and observe what happens to the variables:
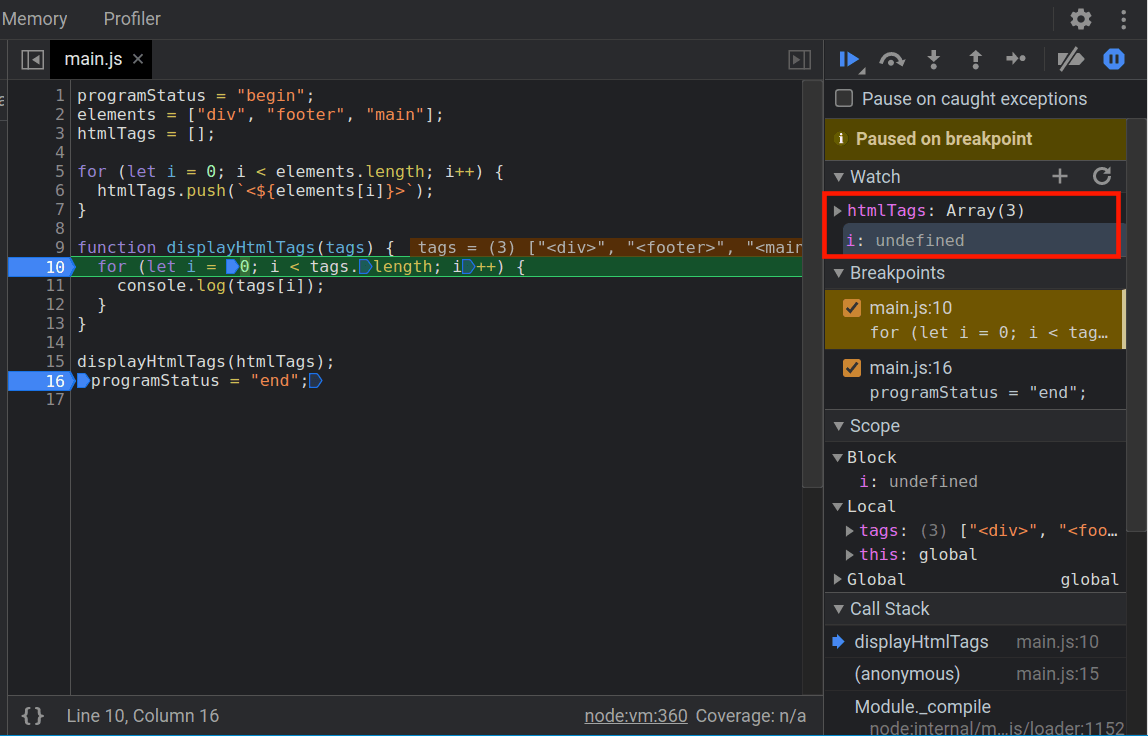
The htmlTags variable is now set to three elements and you can expand it to see the elements. Now, if you continue stepping through the code, you will see the variables being updated during each step.
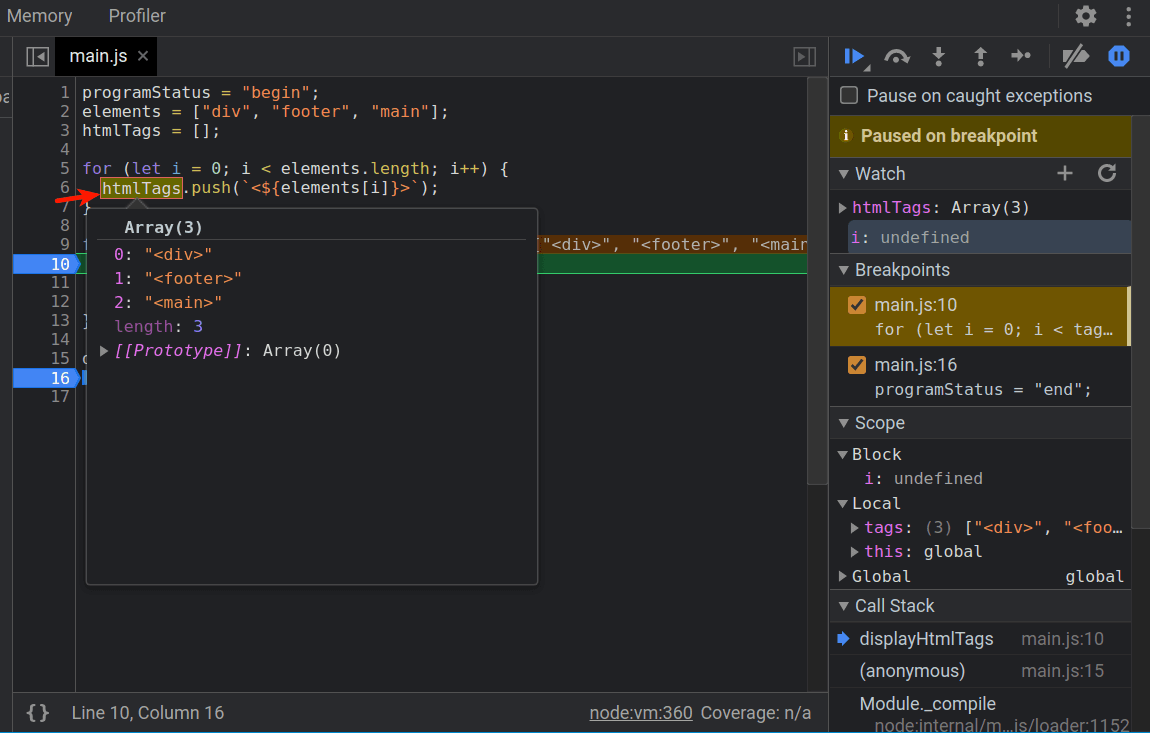
You can also examine a variable value without watching it. To do that, hover over any variable and the debugger will show you the variable contents:
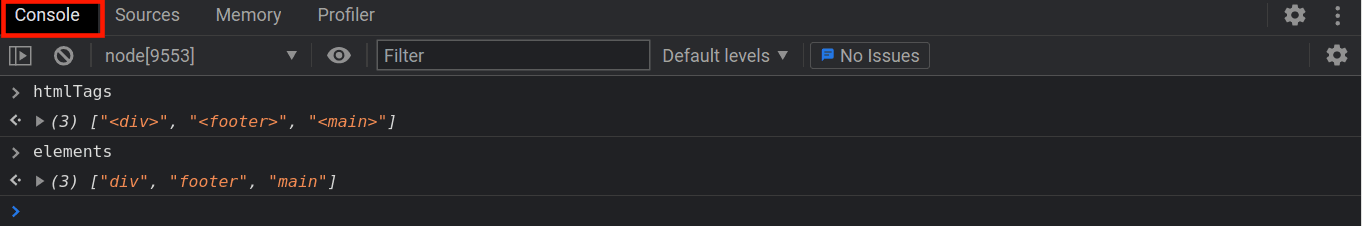
If you need to experiment with variables, you can also use the console tab:
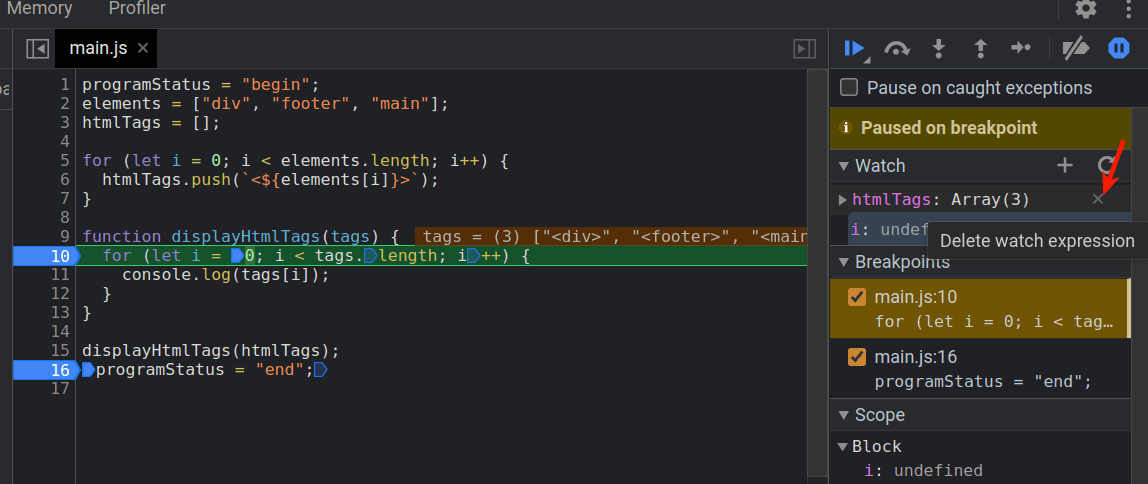
Similar to breakpoints, when you watch variables, the variable you are watching persists when you close the debugger window. To unwatch variables, hover the variable you want to unwatch, then click the Delete watch expression button.
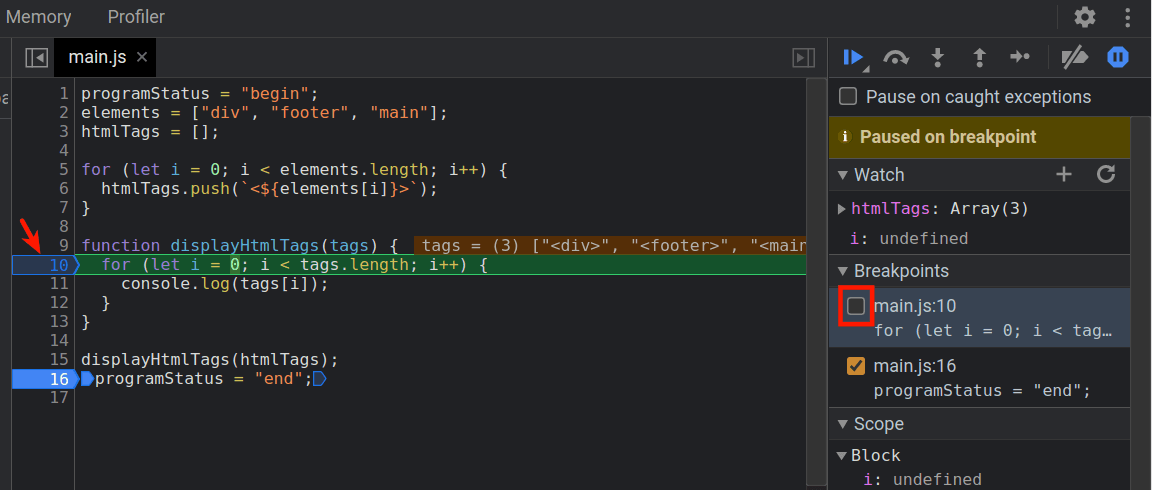
To temporary deactivate a breakpoint, uncheck the breakpoint in the breakpoints pane:
If you want to deactivate all breakpoints, click Deactivate breakpoints:
![]()
To remove a breakpoint, click the breakpoint you want to remove in the line number column. After removing the breakpoints, exit the debugger.
Now that you can watch variables, you will use the debugger statement next.
Using The debugger Statement
In this section, you will use the debugger statement, which tells the debugger where to pause in the code.
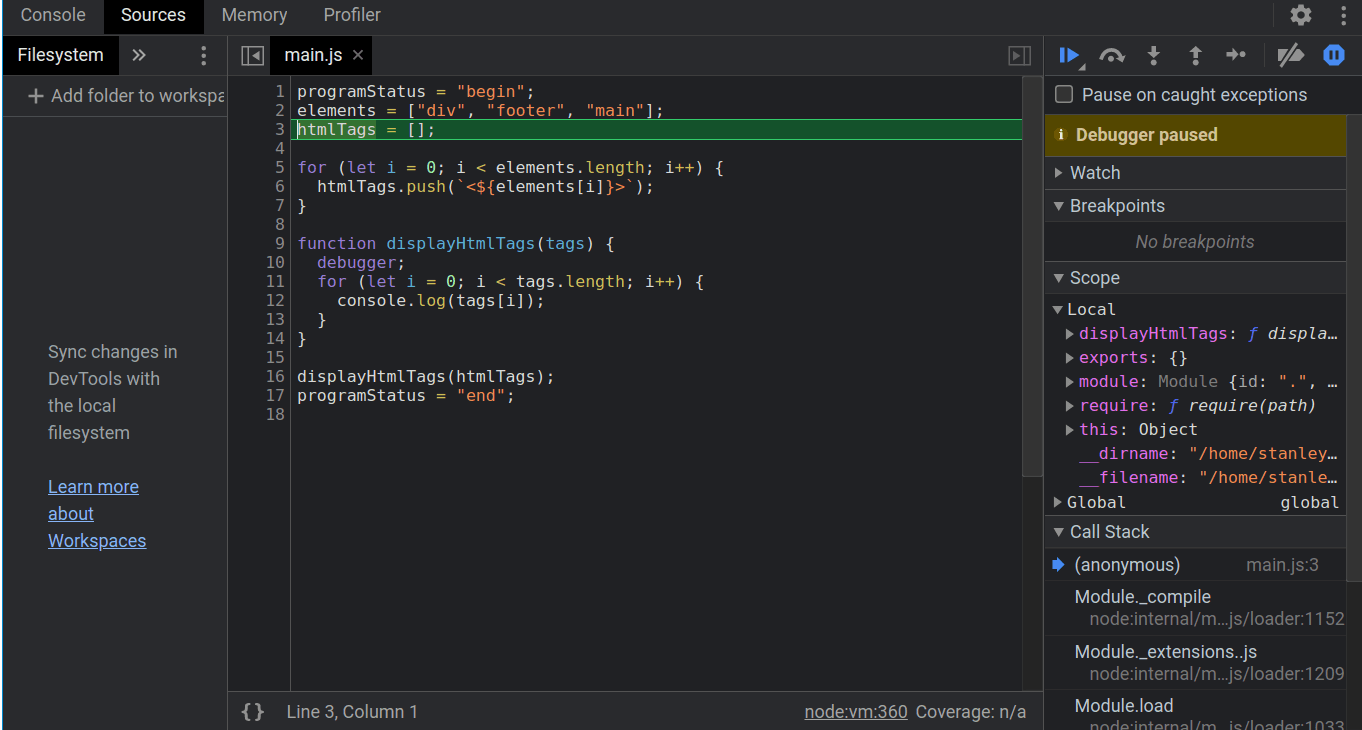
To use it, open the main.js file and add the debugger statement on line 10:
...
function displayHtmlTags(tags) {
  debugger;
  for (let i = 0; i < tags.length; i++) {
    console.log(tags[i]);
  }
}
...
Start the debugger session:
- node --inspect-brk main.js
Refresh or visit chrome://inspect in Chrome. Under devices, click inspect.
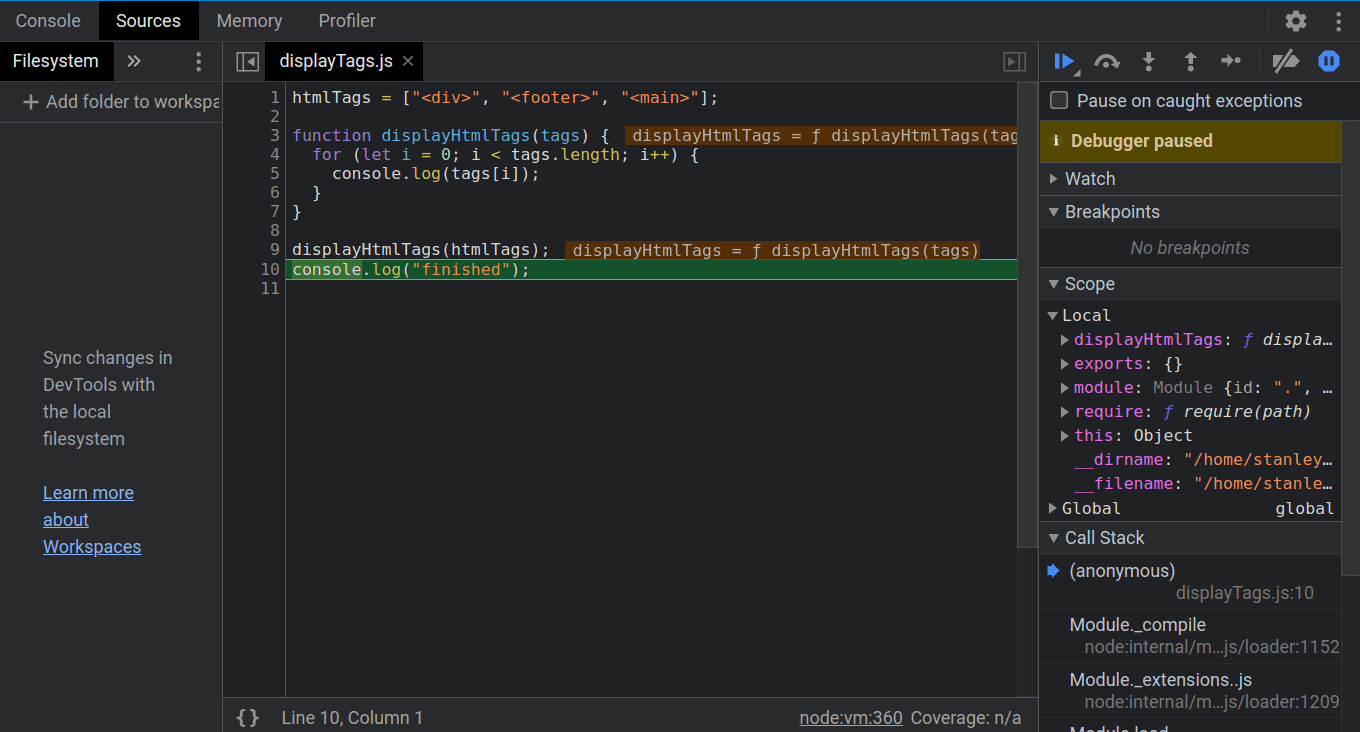
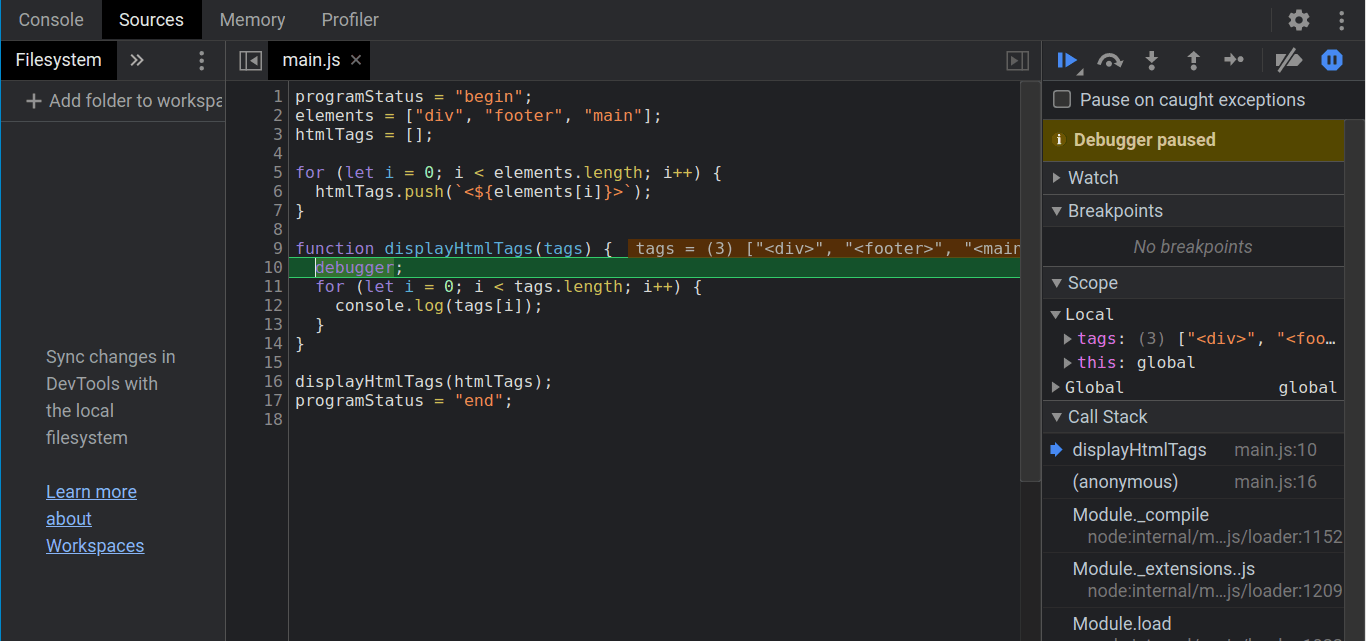
When the debugger opens, it will pause on line 1. To pause on the line where the debugger statement is, click Resume script execution:
With that, you can use the debugger statement to specify the lines where the debugger should pause.
Conclusion
In this tutorial, you used the Chrome debugger to debug a Node.js application. You learned how to step through code using buttons. You then added breakpoints to specify where the debugger should pause. After that, you watched variables and also learned how to unwatch, deactivate and remove breakpoints. Finally, you used the debugger statement to specify where the debugger should pause.
To continue learning how to use the debugger, see JavaScript debugging reference. If you want to learn how to use the Node.js command-line debugger, see How To Debug Node.js Code with the Node.js Debugger.